2026 Fact Sheet
Developing the Tier 1 Warintza Project in Ecuador
A globally significant copper-gold porphyry deposit with all the hallmarks of a Tier 1 asset: scale, grade, infrastructure and long-term potential — a rare opportunity to develop a multi-generational mine with global impact.
- Total resource
- 5.8Bt
- Reserve life
- +20 yrs
- Post-tax NPV8%
- $4.6bn
- Post-tax IRR
- 26%
Company snapshot
Listings
TSX: SLS
NYSE: SLSR
Incorporated in Canada, headquartered in Switzerland.
Market capitalisation
C$1.9 billion
≈ US$1.4 billion
Among the more substantial listed copper development companies globally.
Funding
US$200 million
Non-dilutive, with Royal Gold
Funded to a construction decision while retaining 100% ownership.
Top ownership
As of July 2026
Richard Warke (Non-Exec Chairman)
36.2%
60,493,546Helikon Investments Ltd
11.3%
17,488,787Earle, Daniel
4.3%
7,114,375BlackRock Investment Management (UK) Ltd.
3.7%
6,152,971Global X Management Co. LLC
2.6%
5,000,000PSquared Asset Management AG
2.4%
4,214,526Beaty, Ross J (Kestral Holding)
2.2%
4,084,315Principal Global Investors LLC
2.0%
3,663,616Orion Resource Partners LP
1.6%
3,304,618Picton Mahoney Asset Management
1.1%
1,888,614
Investment case
PFS confirms Warintza's Tier 1 status
Global scale resource with multi-decade mine life and first quartile costs driving significant EBITDA and FCF.
District scale, no attachment to a major
One of the few copper projects globally with multigenerational scale and full strategic independence.
Operational simplicity
Conventional open pit mining at low elevation, leveraging a conventional processing plant.
Social licence and favourable jurisdiction
Impact & Benefits Agreement signed, with Municipal, Provincial and Federal government endorsements.
Latam exploration portfolio
Early-stage assets offering unrecognised upside, with a focus on unlocking value through derisking.
Experienced team
Diverse skillsets covering all critical elements required at this stage of Solaris' development.
Fully funded to feasibility
US$200mm non-dilutive financing package with Royal Gold, retaining 100% ownership.
PFS highlights
Confirms Warintza's status as a Tier 1 project
Key features of Warintza
- 312% increase in M&I Mineral Resources compared to the 2024 MRE
- Downhill loaded haul from pit drives 1st quartile costs
- Excellent access to infrastructure (water, power, roads, labour, etc)
- Clean high-quality concentrate providing marketing flexibility
- Significant potential to extend LOM by 25 to 30 years beyond Reserves
- PFS prepared in conjunction with highly experienced consultants
Key PFS outputs
Production (CuEq)(1)
304kt
Avg. Y1-5
242kt
Avg. Y1-15
Reserve life
+20 years
LOM strip ratio
0.53:1
First Quartile AISC(2)
$0.85/lb
Avg. Y1-5
$1.07/lb
Avg. Y1-15
Capital intensity
US$3,684mm pre-production capex
US$15,440/t(3)
Post-tax NPV8% and IRR
$4.6bn(4)
26%
Annual EBITDA(4)
$1.9bn
Avg. Y1-5
$1.4bn
Avg. Y1-15
Annual post-tax FCF(4)
$1.3bn
Avg. Y1-5
$1.0bn
Avg. Y1-15
Post-tax payback period
2.6 years
Source: Warintza PFS
- 1.Copper equivalent production based on metal prices of US$4.50/lb Cu, US$20.00/lb Mo, US$28.00/oz Ag and US$2,800/oz Au
- 2.By-product AISC, inclusive of the Royal Gold stream and royalty
- 3.Capital Intensity calculated as Initial Capex / Avg Annual CuEq. Produced for first 15 years
- 4.Commodity price assumptions: US$4.50/lb Cu, US$20.00/lb Mo, US$28.00/oz Ag and US$2,800/oz Au for years 1-3 then US$2,500/oz for years 4-22
Ore reserves & mineral resources
Contained CuEq (kt)
- Reserves for 22-year operation
- Significant potential to extend LOM by 25 - 30 years beyond Reserves
- Reserves represent less than a third of Warintza's current resource endowment
Basis for PFS
Reserves
Further exploration potential
Resources
← Swipe to see the full table →
| Category | Tonnage (Mt) | CuEq % | Cu % | Au g/t | Mo % | Ag g/t | CuEq (kt) | Cu (kt) |
|---|---|---|---|---|---|---|---|---|
| Proven | 797 | 0.49% | 0.37% | 0.05 | 0.02% | 1.37 | 3,884 | 2,957 |
| Probable | 503 | 0.28% | 0.22% | 0.03 | 0.01% | 1.19 | 1,410 | 1,123 |
| Total Reserves | 1,300 | 0.41% | 0.31% | 0.04 | 0.02% | 1.30 | 5,294 | 4,080 |
| Measured | 1,196 | 0.45% | 0.35% | 0.04 | 0.02% | 1.31 | 5,428 | 4,149 |
| Indicated | 2,550 | 0.25% | 0.20% | 0.03 | 0.01% | 1.13 | 6,392 | 4,986 |
| Total M&I Resources | 3,746 | 0.32% | 0.24% | 0.04 | 0.01% | 1.19 | 11,820 | 9,135 |
| Inferred Resources | 2,092 | 0.20% | 0.16% | 0.02 | 0.01% | 1.11 | 4,276 | 3,341 |
Source: Wood Mackenzie, Technical Reports, Warintza PFS Model
- 1.Excludes projects with LOM average copper equivalent production < 100 ktpa
- 2.Copper equivalent production obtained from Technical Report if disclosed, otherwise calculated based on metal prices of US$4.50/lb Cu, US$20.00/lb Mo, US$28.00/oz Ag and US$2,500/oz Au
Warintza benchmarking
Global scale & flexibility
Average annual copper equivalent production (kt).
of the top 30 greenfield copper projects of scale remain unattached to a major — Warintza is one of them.
- Reko Diq
- Warintza (Yr 1-5)304
- La Granja
- El Pachon
- Pebble
- NuevaUnion
- Michiquillay
- Galore Creek
- Warintza (Yr 1-15)242
- Taca Taca
- Golpu
- Josemaria
- Los Azules
- Haquira
- Galeno
- Vizcachitas
- Cascabel
- Casino
- Schaft Creek
- Tampakan
- Los Chancas
- Canariaco
- El Arco
- Ruta del Cobre
- La Arena II
- Costa Fuego
- Santo Tomas
- Ann Mason
- Copper Creek
- Tia Maria
- Arctic
- Yandera
Source: Wood Mackenzie, Technical Reports, Warintza PFS Model. Excludes projects with LOM average copper equivalent production < 100 ktpa.
District potential and scale
Warintza cluster and district opportunity
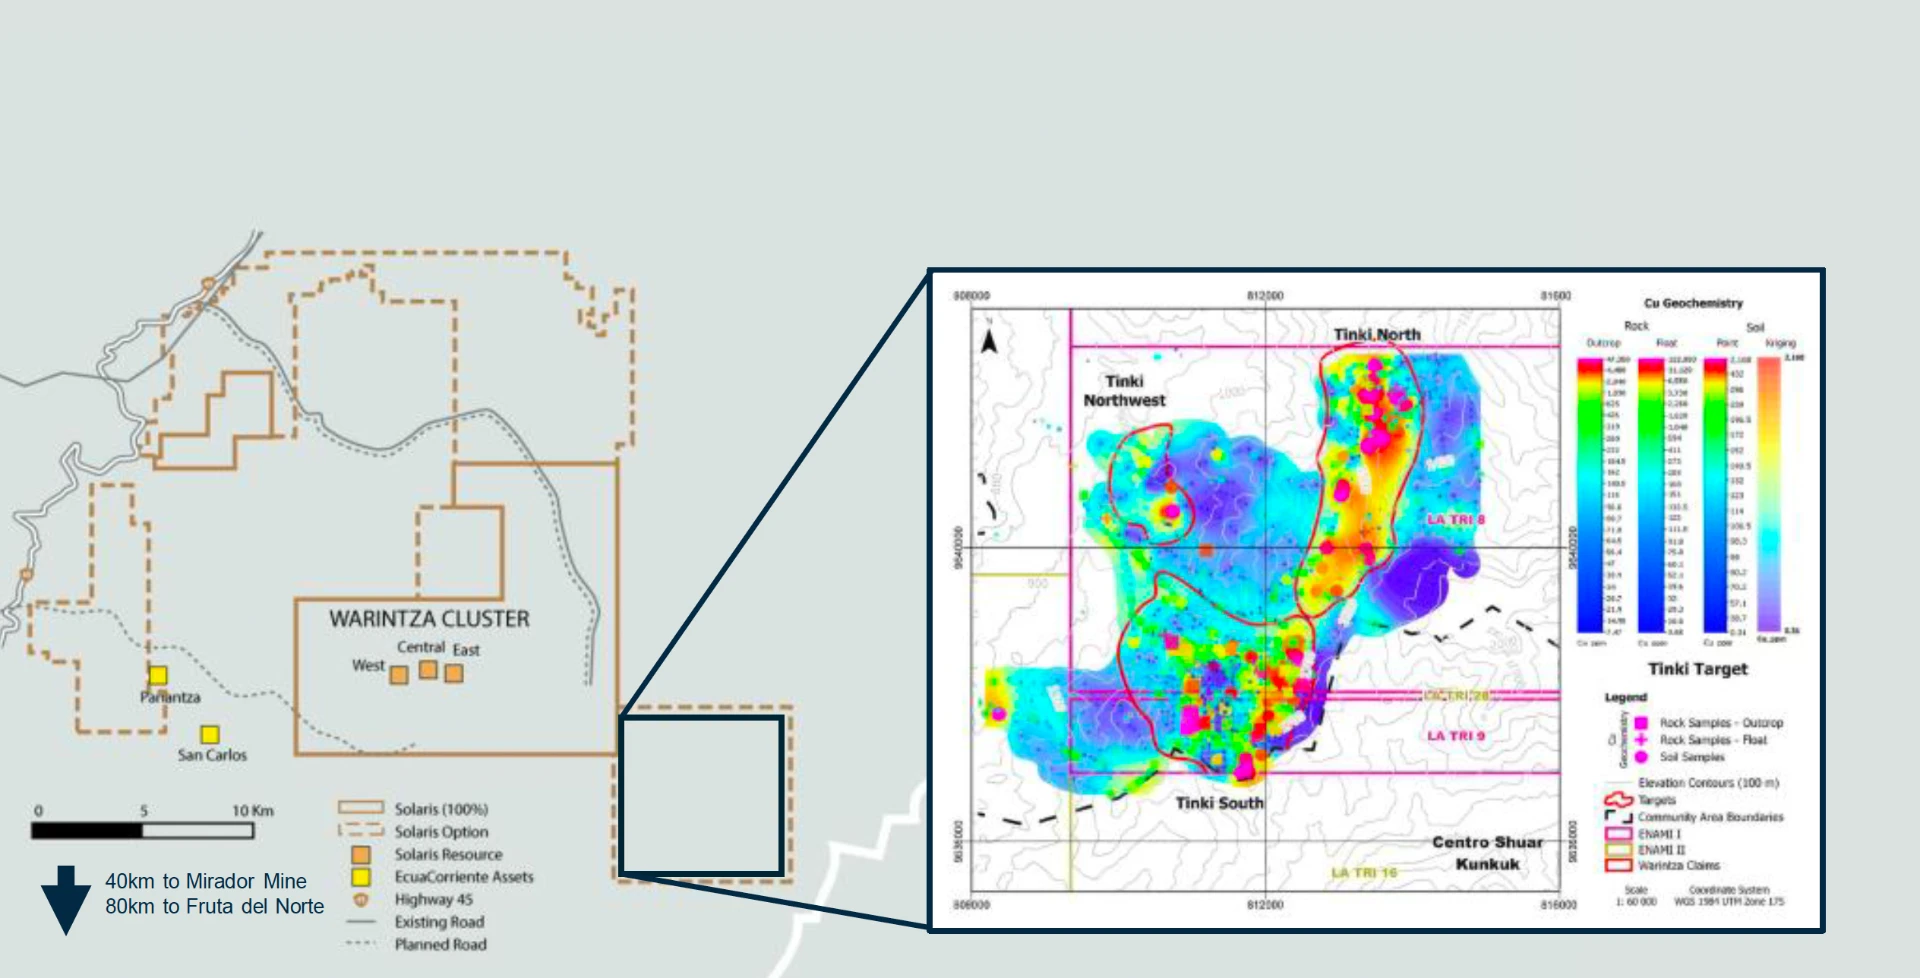
Potential to become one of the world’s largest undeveloped copper clusters
Resources at Warintza (Mt)
Resources at San Carlos & Panantza (Mt)
Further exploration potential in the district
Note: San Carlos and Panantza are independent of Solaris; they are no guarantee of the future performance of Solaris projects and no inference can be made of mineral resources or reserves from adjacent deposits.
1. Preliminary Assessment Report, Panantza & San Carlos Copper Project, Morona-Santiago, Ecuador (effective date October 30, 2007).
Take the full fact sheet with you
The complete 2026 Solaris Resources Fact Sheet, including benchmarking and district potential.